Rust on the ESP32 - SVD's, PAC's and USB flashing
Since my last post I've been working on building the humble beginnings of an ecosystem around the ESP32 for Rust. The short version of this post is as follows:
- This PR means the quickstart repo can now flash and run code without a debugger! Simply using the
flashorflash_releasescripts will flash your code and begin running your code - idf2svd has been created which uses the documentation from
esp-idfto generate svd files fit for consumption by svd2rust - Based on the generated SVD file, there is now a PAC (Peripheral access crate) for the ESP32.
Fixing xtensa-rust-quickstart
As noted in my previous post, running Rust applications on the ESP32 required the use of a JTAG debugger as the board would reset repeatedly. My suspicion was a watch dog reset, but my initial experiments on disabling the watchdog did not appear to be working. I decided to inspect the openocd source to see what the debugger does when it connects, it turns out that the ESP32 has another 2 timer based watch dogs as seen being disabled by openocd here; after disabling those two watchdogs, its was possible to flash and run code with just the USB cable connected!
Creating the esp32 peripheral access crate
The SVD format was created for ARM processors, but as it turns out it works very well for other processor architectures too. Espressif (unsuprisingly) don't provide an SVD file, so I would have to create my own; but before I move on to that, what do we actually get from creating and SVD file for the ESP32? Well, it allows us to use svd2rust to generate really nice register access API's. In the last post, all peripheral manipulation was achieved through seemingly random volatile writes at given addresses; of course this still needs to happen, but do we need to care about the address and bitshift values? svd2rust hides all of that behind a simple, well documented API which makes developing higher level abstractions far simpler. For example, disabling the rtc watchdog looks like this:
fn disable_rtc_wdt(rtccntl: &mut esp32::RTCCNTL) {
    /* Disables write protection */
    rtccntl.wdtwprotect.write(|w| unsafe { w.bits(WDT_WKEY_VALUE) });
    /* Disables all wdt stages & the global watchdog flag itself */
    rtccntl.wdtconfig0.modify(|_, w| unsafe {
        w
        .wdt_stg0()
        .bits(0x0)
        .wdt_stg1()
        .bits(0x0)
        .wdt_stg2()
        .bits(0x0)
        .wdt_stg3()
        .bits(0x0)
        .wdt_flashboot_mod_en()
        .clear_bit()
        .wdt_en()
        .clear_bit()
    });
    /* Re-enables write protection */
    rtccntl.wdtwprotect.write(|w| unsafe { w.bits(0x0) });
}
Not a single address or bitshift in sight!
To generate the initial SVD, the data has to come from somewhere. Intially @jeandudey put together an SVD including just the GPIO peripheral, but this approach would be a lot of work to generate info for the entire chip. I decided to explore parsing the info from the esp-idf (Espressif's C based HAL/libs) code documentation, hence idf2svd was born; it does a pretty good job of scraping 95%~ of the data we need but there are still a few things that could be improved.
Fortunately a lot of the issues with the generated data can be fixed with the svd patching tool, there have already been a few PR's to fix missing peripherals that idf2svd missed or clean up register and bitfield names. Any PR's to clean up the SVD are very welcome!
Bonus: Using cortex-m debug with the ESP32
A side effect of creating the SVD file for svd2rust is that we can now use that SVD file in other applications. The arm developers among you may have heard of an vscode extension called cortex-m debug, on top of GDB debugging, it provides really nice info about the state of the registers and peripherals; it does this by, yep you guessed it, using the SVD files that cortex-m silicon vendors provide.
Getting it running with the ESP32 is actually pretty simple; instead of using the arm gdb we will be using xtensa-esp32-elf-gdb which we can get from downloading the xtensa toolchain from Espressif, along with their openocd server.
Configuration
Here is the example configuration taken from xtensa-rust-quickstart; its important to note that cortex-m debug expects the toolchain's gdb to be called arm-non-eabi-gdb hence, where ever you specify the toolchain path there must be a file called arm-none-eabi-gdb else it won't work. I chose to just symlink xtensa-esp32-elf-gdb to arm-none-eabi-gdb inside that directory.
// the config inside launch.json
{
    "cwd": "${workspaceRoot}",
    "executable": "target/xtensa-esp32-none-elf/debug/esp32",
    "name": "debug-with-svd",
    "request": "attach",
    "type": "cortex-debug",
    "servertype": "openocd",
    "interface": "jtag",
    /* Download this from the latest `esp32` crate: https://docs.rs/esp32/latest/esp32/ */
    "svdFile": "svd/esp32.svd",
    // complains about not allowed,
    // but it does work.. https://github.com/Marus/cortex-debug/issues/111#issuecomment-504778053
    "serverpath": "${env:HOME}/programs/openocd-esp32/bin/openocd",
    // for this to work you will have to run `ln -s xtensa-esp32-elf-gdb arm-none-eabi-gdb`
    "toolchainPath": "${env:HOME}/programs/xtensa-esp32-elf/bin",
    "configFiles": [
        "openocd.cfg"
    ],
},
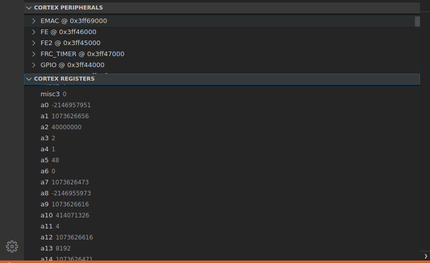
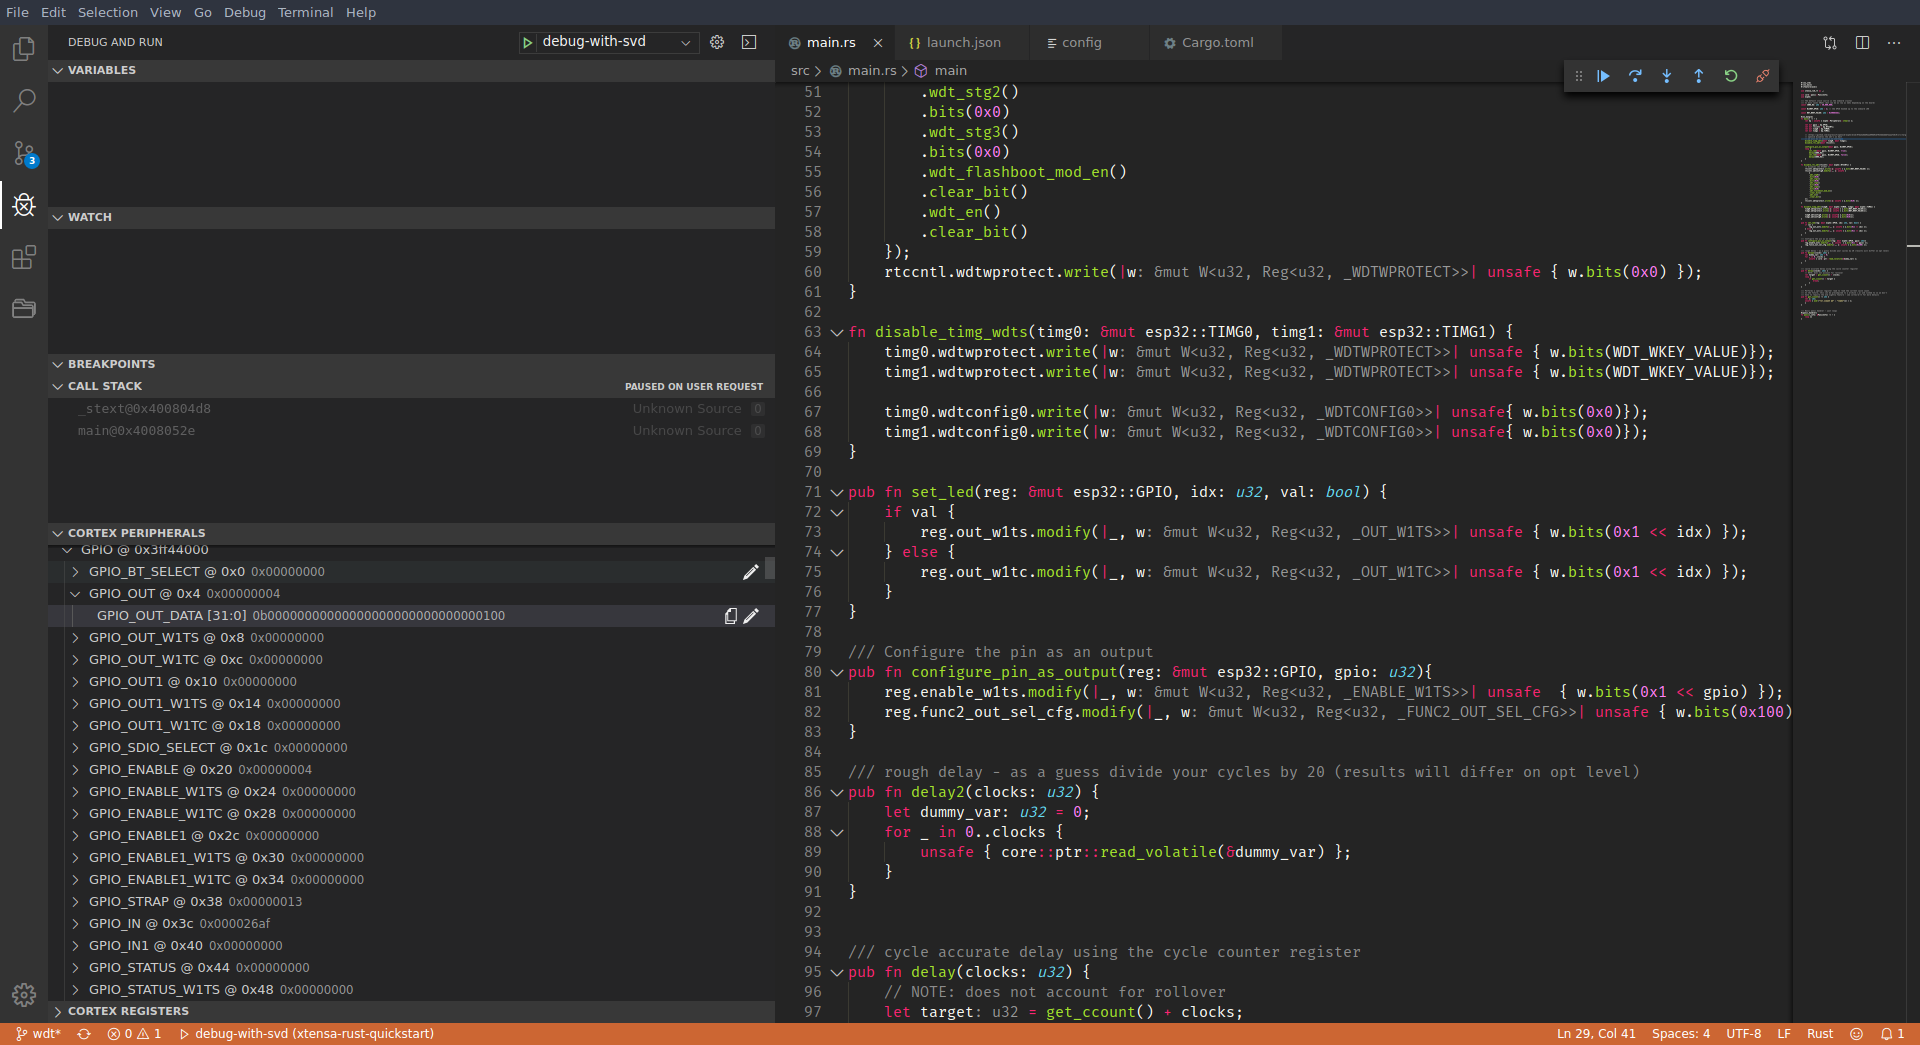 It even shows you the processor register values!
The best part about this approach is that it's language & framework agnostic, meaning if you use the esp-idf, the arduino core or anything else you can still use the SVD even if your not using Rust. Like I said earlier the SVD is still a little rough around the edges, so patches are very welcome!
What's next
At the time of writing the Espressif have just released there third iteration of their llvm fork, so I will be spending a lot of time building and updating the forks and libraries to support that. The new fork should also fix some long standing and annoying bugs outlined in my first post. Expect another post soon if thats the case!
Finally, if you appreciate the effort going into this project, consider sponsoring me on Github.
Links
- xtensa-quickstart - A quickstart project for using Rust on xtensa
- rust-xtensa - The xtensa fork of Rust
- esp-rs - The
esp-rsorganization - github - My github